London Session + EMA 200 + UT BotCombined trading indicator featuring three powerful tools:🔵 London Session Box - Highlights the London trading session (0700-1600) with a customizable colored box to identify high-volume trading periods📈 EMA 200 - Exponential Moving Average for trend identification and dynamic support/resistance levels🎯 UT Bot - ATR-based trailing stop indicator with buy/sell signals and bar coloring for trend following
ค้นหาในสคริปต์สำหรับ "Trailing stop"

Session & ATR Trailing Stop mindedgean indicator that highlights the asian range where i look for the 15m fractal to be swept and then i trade in the opposite direction

Proactive Execution MachineProactive Execution Machine: Multi-State Momentum Engine
Overview
The Proactive Execution Machine is a comprehensive trading workspace designed to filter market noise and highlight high-probability execution windows. It combines Dynamic Supply/Demand Zones, Manual Level Proximity, and a proprietary Dual-Candle Momentum Scoring system to categorize the market into specific "States" in real-time.
Instead of a simple arrow, this script provides a System Status dashboard that tells you exactly what phase the market is in—whether it's "Level Absorption," a "Demand Vortex," or a "Tired Trend. "Core Components
1. The Momentum Gauge (Bottom Left)
This table provides a deep-dive into order flow by scoring the last two candles based on:
Close Location: Where price closed relative to its range (Upper, Middle, Lower).
Body-to-Wick Ratio: Measuring the "effort vs. result" of the move.
Range Relativity: Whether the current bar is an "Inside" or "Outside" bar relative to the previous candle.
Slope (Linear Regression): A real-time trendline of momentum strength to see if conviction is accelerating or decelerating.
2. Dynamic State Engine The script automatically identifies and colors the chart into three primary zones:
Supply Zone (Red): The upper 30% of the recent price discovery range.
Demand Zone (Green): The lower 30% of the recent price discovery range.
Proximity Zones: When price nears your Manual Levels (PDH, PDL, NY Open, etc.), the engine switches priority to monitor for "Breakouts" or "Level Attacks."
3. System Status (Bottom Right)The dynamic HUD changes size and color based on conviction levels. It will notify you of specific market conditions:
Supply/Demand Overrun: When momentum is so strong it is smashing through reversal zones. Level Absorption/Stalling: When price reaches a key level but momentum has "flattened," suggesting a potential reversal or high-volume churn.
Buy/Sell Now: High-conviction signals triggered only when Location (Zone) and Momentum (Score) align.
How to Trade with the "Machine"
For Trend Followers: Look for the status "TREND (ACTIVE)" combined with a Momentum Score of $\pm 4$ or higher.
For Reversion Traders: Watch for "WATCH LONGS/SHORTS" when price enters a Supply or Demand zone. Wait for the status to flip to "BUY/SELL NOW" as momentum begins to shift back toward the mean.
For Level Traders: Input your daily levels (VAH, VAL, POC) in the settings. The machine will automatically prioritize these levels, changing status to "AT LEVEL" the moment price enters your specified proximity.
Key Settings
Manual Levels: Input up to 5 custom price levels for the proximity engine.
Proximity Sensitivity: Adjust how close price must be to a level (in points/pips) to trigger an "At Level" state.
Aggression (1-5): Tuning the pivot detection. Lower numbers respond faster to micro-structure; higher numbers focus on major swing points.
Visual Coding
Candle bodies are colored to assist with single candle pattern detection:
Lime/Pink Bar Highlights: The script uses a custom color engine to highlight "Shaved" (Marubozu) bars.
Lime indicates aggressive bullish conviction, while Pink (Fuchsia) highlights aggressive bearish conviction.
Green indicates bull engulfing candle
Red indicates bear engulfing candle
Orange is an outside bar
Yellow an inside bar
Gray a Doji bar
Black all other bars
Dynamic Zones: The chart features two primary background areas:
Red Zone (Top): The Supply Zone, identifying where sellers historically reclaim control.
Green Zone (Bottom): The Demand Zone, identifying where buyers historically step in.
System Status HUD (Bottom Right): This is the "brain" of the machine. The text size is adjusted to attract the trader's attention when the slope of the momentum increases above 5 (bullish expansion) or greater than - 5 (Bearish expansion). The system status changes color based on the market state too:
HUD Coloring:
Aqua: Active Bullish Trend.
Gray: Bull trend tired.
Orange: Active Bearish Trend.
Gray: Bear trend tired.
Red: For sell now.
Green: For buy now.
Lime: Bull price level under attack.
Marron: Bear price level under attack.
Gray: Price level absorption.
Yellow: Price at level and stalling.
Maroon: An "Overrun" or "Vortex" where price is smashing through supply/demand with extreme momentum.
The text size serves as a "Volatility Alarm." * When the text is Small, the market is in a "sideways" or "absorbing" state. You should be cautious about entering new trend trades.
When the text is Large, the Machine has detected that "Aggressive" participants have entered the order flow. This is your cue that a "Level Attack" or a "Trend Breakout" is currently in progress.
The 1-Minute Tactical Setup Guide:
Proactive Execution Machine Operating on the 1-minute (1m) timeframe requires a balance between speed and noise filtration. Because the Proactive Execution Machine uses a "State Engine" logic, it is uniquely suited for the high-velocity environment of the NY Open.
I follow these three tactical steps to optimize the chart for the 1m timeframe:
Step 1: Calibrate the "Proximity Sensitivity" On a 1m chart, a "Level" isn't a single price—it's a zone.
Adjustment: In the script settings, set your Proximity Sensitivity to a value that represents the average "noise" of your instrument.
For ES (S&P 500 Futures): 1.5 to 2.5 points.
For NQ (Nasdaq Futures): 5 to 10 points.
For Forex (EURUSD): 1 to 2 pips.
The Goal: You want the "AT LEVEL" status to trigger just as price is "sniffing" the level, giving you time to prepare your order before the touch.
Step 2: Watch the "History" Column in the Momentum Gauge
The bottom-left table is your most important tool for the 1m chart. It shows you the momentum of the last three bars ($T-0$, $T-1$, $T-2$).
Momentum Sequence: Look for a "Sequence of Three." If you see $T-2$ (Neutral), $T-1$ (Long), and $T-0$ (STR Long), you have a momentum explosion.
The Trap: If you see STR LONG followed immediately by a NEUTRAL bar while in a Supply Zone, the "Machine" will shift to "SUPPLY STALLING." This is your signal to tighten your trailing stop or take profit—it means the bulls are hitting a wall of sell orders.
Step 3: The "Level Attack" Execution
The script features a unique state called "LEVEL ATTACK." This is designed specifically for breakout/breakdown traders.
The Setup: Price is approaching a Manual Level (like the NY Open or PDH).
The Signal: If the status changes to "LEVEL ATTACK (BULL)," it means the momentum score is high ($>3$) and the slope is positive while within the proximity of the level.
The Action: This is a "Proactive" entry. Instead of waiting for the candle to close above the level, you are entering as the "Machine" detects institutional pressure "attacking" the level.
Daily Routine for the "Machine"
1) 09:25 AM: Input your 5 manual levels (PDH, PDL, NY Open, VAH, VAL).
2) 09:30 AM: Wait for the first 5 minutes of volatility to settle.
3) The Window: Look for the System Status to move from "IDLE" to a colored state.
4) The Trigger: Never take a signal if the Momentum Gauge is in the "Neutral" (Yellow) zone. Only execute when the gauge shows LONG/SHORT or STR LONG/STR SHORT.

CVD Zones & Divergence [Pro]# CVD Zones & Divergence
**Complete CVD order flow toolkit** - Divergences, POC, Profile, and Supply/Demand zones all in one professional indicator.
## 🎯 What It Does
Combines **four powerful order flow tools** into a single, cohesive indicator:
1. **CVD Divergences** - Early warnings + confirmed signals
2. **Point of Control (POC)** - Fair value equilibrium line
3. **CVD Profile** - Visual distribution histogram
4. **Supply/Demand Zones** - Real absorption-based S/R levels
All based on **Cumulative Volume Delta (CVD)** - actual buying/selling pressure, not approximations.
## ✨ Key Features
### 🔄 CVD Divergences (Dual Mode)
**Confirmed Divergences** (High Accuracy)
- Solid lines (customizable colors)
- 🔻 Bear / 🔺 Bull labels
- Win rate: ~70-80%
- Best for swing traders
**Early Warning Mode** ⚡ (Fast Signals)
- Dashed lines (default purple)
- ⚠️ Early Bear / ⚠️ Early Bull labels
- Fires 6+ bars earlier
- Win rate: ~55-65%
- Best for scalpers/day traders
### 🎯 Point of Control (POC)
- **Independent lookback** (300 bars default)
- Yellow line showing fair value
- Where most CVD activity occurred
- Acts as dynamic support/resistance
- Resets and recalculates continuously
### 📊 CVD Profile Histogram
- **Visual CVD distribution** over lookback period
- **Split buy/sell** (blue/orange bars)
- **Value Area** (70% CVD zone highlighted)
- Position: Right/Left/Current (your choice)
- Shows where actual order flow happened
### 📦 Supply/Demand Zones
- **Absorption-based** detection (not guesses!)
- Green = Demand (buyers absorbed 2:1+)
- Red = Supply (sellers absorbed 2:1+)
- Shows **real** institutional levels
- Auto-sorted by strength
- Displays top 8 zones
## 📊 What You See on Chart
```
Your Chart:
├─ 🔴 Red lines (bearish divergences)
├─ 🟢 Green lines (bullish divergences)
├─ 🟣 Purple dashed (early warnings)
├─ 🟡 Yellow POC line (fair value)
├─ 📊 Blue/Orange profile (right side)
├─ 🟢 Green boxes (demand zones)
└─ 🔴 Red boxes (supply zones)
```
## ⚙️ Recommended Settings
### 15m Day Trading (Most Popular)
```
📊 Profile:
- Lookback: 150 bars
- Profile Rows: 24
- Position: Right
🎯 POC:
- POC Lookback: 300 bars
- Show POC: ON
📦 Zones:
- Min Absorption Ratio: 2.0
- HVN Threshold: 1.5
- Max Zones: 8
🔄 Divergences:
- Pivot L/R: 9
- Early Warning: ON
- Early Right Bars: 3
- Min Bars Between: 40
- Min CVD Diff: 5%
```
### 5m Scalping
```
Profile Lookback: 100
POC Lookback: 200
Pivot L/R: 7
Early Warning Right: 2
Min Bars Between: 60
```
### 1H Swing Trading
```
Profile Lookback: 200
POC Lookback: 400-500
Pivot L/R: 12-14
Early Warning Right: 4-5
Min Bars Between: 30
Min CVD Diff: 8%
```
## 💡 How to Trade
### Setup 1: Divergence at Zone ⭐ (BEST - 75%+ win rate)
**Entry:**
- Price hits demand/supply zone
- Divergence appears (early or confirmed)
- Double confluence = high probability
**Example (Long):**
```
1. Price drops into green demand zone
2. ⚠️ Early bullish divergence fires
3. Enter long with tight stop below zone
4. Target: POC or next supply zone
```
**Risk/Reward:** 1:3 to 1:5
---
### Setup 2: POC Bounce/Rejection
**Entry:**
- Price approaches POC line
- Wait for reaction (bounce or rejection)
- Enter in direction of reaction
**Long Setup:**
```
1. Price pulls back to POC from above
2. POC acts as support
3. Bullish divergence appears (confirmation)
4. Enter long, stop below POC
```
**Short Setup:**
```
1. Price rallies to POC from below
2. POC acts as resistance
3. Bearish divergence appears
4. Enter short, stop above POC
```
**Risk/Reward:** 1:2 to 1:4
---
### Setup 3: Zone + Profile Confluence
**Entry:**
- Supply/demand zone aligns with thick profile bar
- Shows high CVD activity at that level
- Triple confluence = very high probability
**Example:**
```
1. Supply zone at 26,100
2. Profile shows heavy selling at 26,100
3. Price rallies to 26,100
4. Bearish divergence appears
5. Enter short
```
**Risk/Reward:** 1:4 to 1:6
---
### Setup 4: Early Warning Scalp ⚡
**Entry (Aggressive):**
- ⚠️ Early warning fires
- Price at zone or POC
- Enter immediately
- Tight stop (1-2 ATR)
**Management:**
```
- Take 50% profit at 1:1
- Move stop to breakeven
- 🔻 Confirmed signal → Trail stop
- Exit rest at target
```
**Risk/Reward:** 1:1.5 to 1:2
**Trades/day:** 3-8
---
### Setup 5: Multi-Timeframe (Advanced)
**Confirmation Required:**
```
Higher TF (1H):
- Confirmed divergence
- At major POC or zone
Lower TF (15m):
- Early warning triggers
- Entry with better timing
```
**Benefits:**
- HTF gives direction
- LTF gives entry
- Best of both worlds
**Risk/Reward:** 1:3 to 1:5
---
## 📊 Component Details
### CVD Profile
**What the colors mean:**
- **Blue bars** = Buying CVD (demand)
- **Orange bars** = Selling CVD (supply)
- **Lighter shade** = Value Area (70% CVD)
- **Thicker bar** = More volume at that price
**How to use:**
- Thick bars = Support/Resistance
- Profile shape shows market structure
- Balanced profile = range
- Skewed profile = trend
---
### Supply/Demand Zones
**How they're detected:**
1. High Volume Node (1.5x average)
2. CVD buy/sell ratio calculated
3. Ratio ≥ 2.0 → Zone created
4. Sorted by strength (top 8 shown)
**Zone labels show:**
- Type: "Demand" or "Supply"
- Ratio: "2.8:1" = strength
**Not like other indicators:**
- ❌ Other tools use price action alone
- ✅ This uses actual CVD absorption
- Shows WHERE limit orders defended levels
---
### Point of Control (POC)
**What it shows:**
- Price with highest CVD activity
- Market's "fair value"
- Dynamic S/R level
**How to use:**
- Price above POC = bullish bias
- Price below POC = bearish bias
- POC retest = trading opportunity
- POC cross = trend change signal
**Independent lookback:**
- Profile: 150 bars (short-term)
- POC: 300 bars (longer-term context)
- Gives stable, relevant POC
---
## 🔧 Settings Explained
### 📊 Profile Settings
**Lookback Bars** (150 default)
- How many bars for profile calculation
- Lower = more recent, reactive
- Higher = more historical, stable
**Profile Rows** (24 default)
- Granularity of distribution
- Lower = coarser (faster)
- Higher = finer detail (slower)
**Profile Position**
- Right: After current price
- Left: Before lookback period
- Current: At lookback start
**Value Area** (70% default)
- Highlights main CVD concentration
- 70% is standard
- Higher % = wider zone
---
### 🎯 POC Settings
**POC Lookback** (300 default)
- Independent from profile
- Longer = more stable POC
- Shorter = more reactive POC
**Show POC Line/Label**
- Toggle visibility
- Customize color/width
---
### 📦 Zone Settings
**Min Absorption Ratio** (2.0 default)
- Buy/Sell threshold for zones
- 2.0 = 2:1 ratio minimum
- Higher = fewer, stronger zones
**HVN Threshold** (1.5 default)
- Volume must be 1.5x average
- Higher = stricter filtering
- Lower = more zones
**Max Zones** (8 default)
- Limits display clutter
- Shows strongest N zones only
---
### 🔄 Divergence Settings
**Pivot Left/Right** (9/9 default)
- Bars to confirm pivot
- Higher = slower, more confirmed
- Lower = faster, less confirmed
**Early Warning**
- ON = Show early signals
- Early Right Bars (3 default)
- 3 = 6 bars faster than confirmed
**Filters:**
- Min Bars Between (40): Prevents spam
- Min CVD Diff % (5): Filters weak signals
**Visual:**
- Line styles: Solid/Dashed/Dotted
- Colors: Customize all 4 types
- Labels: Toggle ON/OFF
---
## 🎨 Color Customization
**Divergences:**
- Bullish Confirmed: Green (default)
- Bearish Confirmed: Red (default)
- Early Bullish: Purple (default)
- Early Bearish: Purple (default)
**Zones & Profile:**
- Bull/Demand: Green
- Bear/Supply: Red
- Buy CVD Profile: Blue
- Sell CVD Profile: Orange
- Value Area Up/Down: Lighter blue/orange
**POC:**
- POC Color: Yellow (default)
All customizable to your preference!
---
## 🔔 Alerts Available
**6 Alert Types:**
1. 🔻 Bearish Divergence (confirmed)
2. 🔺 Bullish Divergence (confirmed)
3. ⚠️ Early Bearish Warning
4. ⚠️ Early Bullish Warning
5. (Manual: POC cross)
6. (Manual: Zone touch)
**Setup:**
1. Click Alert (⏰)
2. Choose "CVD Zones & Divergence"
3. Select alert type
4. Configure notification
5. Create!
---
## 💎 Pro Tips
### From Experienced Traders:
**"Use zones with divergences for best setups"**
- Zone alone: 60% win rate
- Divergence alone: 65% win rate
- Both together: 75%+ win rate
**"POC is your friend"**
- Price tends to revert to POC
- Great target for counter-trend trades
- POC cross = potential trend change
**"Profile tells the story"**
- Thick bars = institutional levels
- Balanced profile = range-bound
- Skewed high = distribution (top)
- Skewed low = accumulation (bottom)
**"Early warnings for entries, confirmed for confidence"**
- Early = better entry price
- Confirmed = validation
- Use both in scale-in strategy
**"Filter by timeframe"**
- 1m-5m: Very fast, many signals
- 15m: Sweet spot for most traders
- 1H-4H: High quality, fewer signals
---
## 🔧 Tuning Guide
### Too Cluttered?
**Simplify:**
```
✅ Show Divergences: ON
✅ Show POC: ON
❌ Show Zones: OFF (or reduce to 4-5)
❌ Show Value Area: OFF
❌ Divergence Labels: OFF
→ Clean chart with just lines + POC
```
### Missing Opportunities?
**More Signals:**
```
↓ Pivot Right: 6-7
↓ Early Warning Right: 2
↓ Min Bars Between: 25-30
↓ Min CVD Diff: 2-3%
↓ Min Absorption Ratio: 1.8
```
### Too Many False Signals?
**Stricter Filters:**
```
↑ Pivot Right: 12-15
↑ Min Bars Between: 60
↑ Min CVD Diff: 8-10%
↑ Min Absorption Ratio: 2.5
↓ Max Zones: 4-5
```
### POC Not Making Sense?
**Adjust POC Lookback:**
```
If too high: Increase to 400-500
If too low: Increase to 400-500
If jumping around: Increase to 500+
→ Longer lookback = more stable POC
```
---
## ❓ FAQ
**Q: Difference from CVD Divergence (standalone)?**
A: This is the **complete package**:
- Divergence tool = divergences only
- This = divergences + POC + profile + zones
- Use divergence tool for clean charts
- Use this for full analysis
**Q: Too slow/laggy?**
A: Reduce computational load:
```
Profile Rows: 18 (from 24)
Lookback: 100 (from 150)
Max Zones: 5 (from 8)
```
**Q: No volume data error?**
A: Symbol has no volume
- Works: Futures, stocks, crypto
- Maybe: Forex (broker-dependent)
- Doesn't work: Some forex pairs
**Q: Can I use just some features?**
A: Absolutely! Toggle what you want:
```
Zones only: Turn off divergences + POC
POC only: Turn off zones + divergences
Divergences only: Turn off zones + POC + profile
Mix and match as needed!
```
**Q: Best timeframe?**
A:
- **1m-5m**: Scalping (busy, many signals)
- **15m**: Day trading ⭐ (recommended)
- **1H-4H**: Swing trading (quality signals)
- **Daily**: Position trading (very selective)
**Q: Works on crypto/forex/stocks?**
A:
- ✅ Futures: Excellent
- ✅ Stocks: Excellent
- ✅ Crypto: Very good (major pairs)
- ⚠️ Forex: Depends on broker volume
---
## 📈 Performance Expectations
### Realistic Win Rates
| Strategy | Win Rate | Avg R/R | Trades/Week |
|----------|----------|---------|-------------|
| Early warnings only | 55-65% | 1:1.5 | 15-30 |
| Confirmed only | 70-80% | 1:2 | 8-15 |
| Divergence + Zone | 75-85% | 1:3 | 5-12 |
| Full confluence (all 4) | 80-90% | 1:4+ | 3-8 |
**Keys to success:**
- Don't trade every signal
- Wait for confluence
- Proper risk management
- Trade what you see, not what you think
---
## 🚀 Quick Start
**New User (5 minutes):**
1. ✅ Add to 15m chart
2. ✅ Default settings work well
3. ✅ Watch for 1 week (don't trade yet!)
4. ✅ Note which setups work best
5. ✅ Backtest on 50+ signals
6. ✅ Start with small size
7. ✅ Scale up slowly
**First Trade Checklist:**
- Divergence + Zone/POC = confluence
- Clear S/R level nearby
- Risk/reward minimum 1:2
- Position size = 1% risk max
- Stop loss placed
- Target identified
- Journal entry ready
---
## 📊 What Makes This Special?
**Most indicators:**
- Use RSI/MACD divergences (lagging)
- Guess at S/R zones (subjective)
- Don't show actual order flow
**This indicator:**
- Uses real CVD (actual volume delta)
- Absorption-based zones (real orders)
- Profile shows distribution (real activity)
- POC shows equilibrium (real fair value)
- All from one data source (coherent)
**Result:**
- Everything aligns
- No conflicting signals
- True order flow analysis
- Professional-grade toolkit
---
## 🎯 Trading Philosophy
**Remember:**
- Indicator shows you WHERE to look
- YOU decide whether to trade
- Quality over quantity always
- Risk management is #1
- Patience beats aggression
**Best trades have:**
- ✅ Multiple confluences
- ✅ Clear risk/reward
- ✅ Obvious invalidation point
- ✅ Aligned with trend/context
**Worst trades have:**
- ❌ Single signal only
- ❌ Poor location (middle of nowhere)
- ❌ Unclear stop placement
- ❌ Counter to all context
---
## ⚠️ Risk Disclaimer
**Important:**
- Past performance ≠ future results
- All trading involves risk
- Only risk what you can afford to lose
- This is a tool, not financial advice
- Use proper position sizing
- Keep a trading journal
- Consider professional advice
**Your responsibility:**
- Which setups to trade
- Position size
- Entry/exit timing
- Risk management
- Emotional control
**Success = Tool + Strategy + Discipline + Risk Management**
---
## 📝 Version History
**v1.0** - Current Release
- CVD divergences (confirmed + early warning)
- Point of Control (independent lookback)
- CVD profile histogram
- Supply/demand absorption zones
- Value area visualization
- 6 alert types
- Full customization
---
## 💬 Community
**Questions?** Drop a comment below
**Success story?** Share with the community
**Feature request?** Let me know
**Bug report?** Provide details in comments
---
**Happy Trading! 🚀📊**
*Professional order flow analysis in one indicator.*
**Like this?** ⭐ Follow for more quality tools!

TradingView Alert Adapter for AlgoWayTRALADAL is a universal TradingView alert adapter designed for traders who work with indicators and want to test and automate indicator-based signals in a structured way.
It allows users to convert indicator outputs into a TradingView strategy and forward the same logic through alerts for multi-platform execution via AlgoWay.
This script can be used as TradingView indicator automation, enabling traders to build a TradingView strategy from indicators and route TradingView alerts through an AlgoWay connector TradingView workflow for multi-platform execution.
Why this adapter is needed
Most TradingView indicators are not available as strategies.
Traders often receive visual signals or alerts but have no access to objective statistics such as win rate, drawdown, or profit factor.
This adapter solves that problem by providing a generic framework that transforms indicator signals into a backtestable strategy — without modifying indicator code and without requiring Pine Script knowledge.
Input source–based design (including closed indicators)
All conditions in TRALADAL are built using input sources, which means you can connect:
Event-based signals (1 / non-zero values, arrows, shapes)
Indicator lines and values (EMA, VWAP, RSI, MACD, etc.)
Outputs from invite-only or closed-source indicators
If an indicator produces a visible signal or alert-compatible output, it can be evaluated and tested using this adapter, even when the source code is locked.
Three-level signal logic
The strategy uses a three-layer condition model commonly applied in discretionary and systematic trading:
Signal — primary entry trigger
Confirmation — directional validation
Filter — additional noise reduction
Each level can be enabled independently and combined using AND / OR logic, allowing traders to test multi-indicator systems without writing complex scripts.
Risk management and alert execution
The adapter supports practical risk parameters:
Stop Loss (pips)
Take Profit (pips)
Trailing Stop (pips)
Two execution modes are available:
Strategy Mode — risk rules are applied inside the TradingView Strategy Tester
Alert Mode — risk parameters are embedded into structured TradingView alerts and handled by AlgoWay during execution
Position sizing follows TradingView conventions (percent of equity, cash, or contracts) to keep strategy results and alerts aligned.
Typical use cases
This TradingView alert adapter is intended for:
Indicator-based trading systems
Backtesting signals from closed or invite-only scripts
Comparing multiple indicators within a single strategy
Sending TradingView alerts to external trading platforms via AlgoWay
The adapter does not generate signals or trading recommendations.
Its purpose is to provide a transparent and testable workflow from indicator signals to TradingView alerts and automated execution.

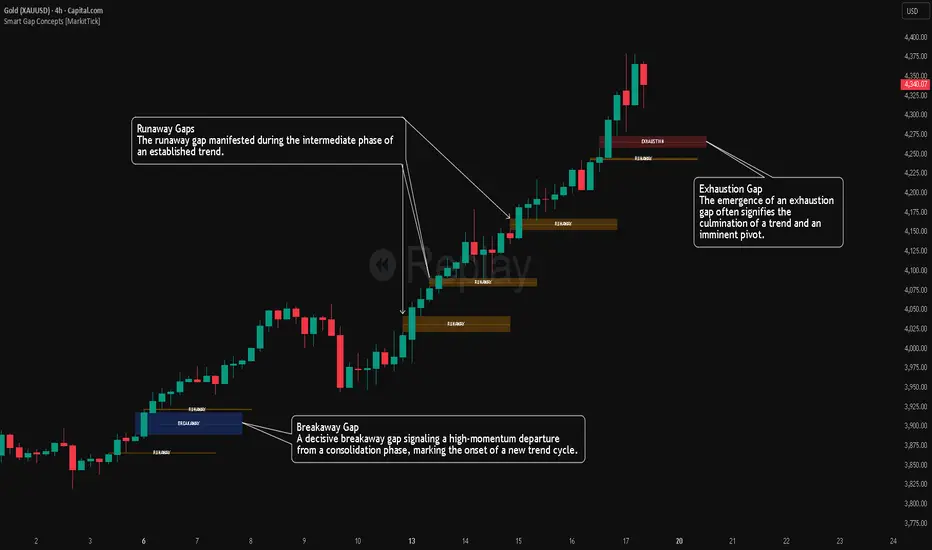
Smart Gap Concepts [MarkitTick]💡 This indicator automates the identification and classification of price gaps, commonly known as Fair Value Gaps (FVG) or Imbalances, by integrating market structure and volume analysis. Unlike standard gap detectors that simply highlight empty space on a chart, this script applies algorithmic filters to categorize gaps into three distinct phases of market movement: Breakaway, Runaway, and Exhaustion. This helps traders understand the potential context of a move rather than just seeing a support or resistance zone.
● Originality and Utility
The primary innovation of this tool is its dynamic classification system. It moves beyond visual detection by checking the "why" behind the gap. By referencing Swing Highs and Swing Lows (Market Structure) alongside Volume efficiency, it determines if a gap represents a breakout, a trend continuation, or a climatic end to a move. Additionally, the script features an automated mitigation tracking system that removes gaps from the chart once price has re-tested the midpoint, ensuring the visual workspace remains clean and relevant to current price action.
● Methodology
The script operates on a multi-stage logic engine:
• Gap Detection
It first identifies the core imbalance where the Low of the current bar does not overlap with the High of the bar two periods prior (for bullish gaps), ensuring the intervening candle represents a strong displacement.
• Structural Analysis (Breakaway Gaps)
The script monitors Pivot Highs and Lows. If a gap occurs simultaneously with a close beyond a key structural Pivot, it is classified as a "Breakaway Gap." This signals the potential start of a new trend.
• Volume and Time Analysis (Exhaustion Gaps)
To identify potential reversals, the script looks for "Trend Maturity." If a gap forms after a long duration since the last pivot and is accompanied by a volume spike (defined by the Volume Spike Multiplier), it is labeled as an "Exhaustion Gap."
• Continuation (Runaway Gaps)
If a gap is valid but meets neither the Breakaway nor Exhaustion criteria, it is considered a "Runaway Gap," typically found in the middle of an established trend.
• Dynamic Cleanup
The script tracks the midpoint of every active gap. If price creates a lower low (for bullish gaps) or higher high (for bearish gaps) beyond this midpoint, the gap is considered mitigated and is removed from the screen.
📖 How to Use
Traders can utilize the color-coded classifications to gauge market intent:
Breakaway (Default Blue): Watch these zones for potential trend initiations. These are often high-probability areas for a retest entry after a structure break.
Runaway (Default Orange): These indicate strong momentum. They can be used to trail stop-losses or add to winning positions, as price should ideally not close below these gaps in a healthy trend.
Exhaustion (Default Red): Be cautious when these appear. They suggest the current move is overextended and a reversal or complex pullback may be imminent.
• Exhaustion Gap : A Practical Case Study
• Breakaway Gap: A Practical Case Study
• Runaway Gap : A Practical Case Study
⚙️ Inputs and Settings
Min Gap Size (Points): Filters out insignificant gaps smaller than this threshold.
Structure Lookback: Defines the sensitivity of the Pivot detection (Swing High/Low).
Volume Avg Length & Multiplier: Determines what qualifies as a "Volume Spike" for exhaustion logic.
Trend Maturity: The minimum number of bars required to consider a trend "old" enough for an exhaustion signal.
Visual Settings: Custom colors for each gap type and box extension length.
● Disclaimer
All provided scripts and indicators are strictly for educational exploration and must not be interpreted as financial advice or a recommendation to execute trades. I expressly disclaim all liability for any financial losses or damages that may result, directly or indirectly, from the reliance on or application of these tools. Market participation carries inherent risk where past performance never guarantees future returns, leaving all investment decisions and due diligence solely at your own discretion.
Solid Dynamic Corridors[AkmanBey]
Solid Dynamic Corridors: Technical Overview
The Solid Dynamic Corridors indicator is a sophisticated, multi-layered trend-following and volatility-channel system. Unlike standard indicators, it combines RSI-derived price projections, ATR-based volatility expansion, and a 20-level support/resistance matrix to identify high-probability trend zones.
1. RSI-Based Price Projection
The foundation of the indicator starts with an inverse calculation of RSI levels. By setting specific overbought (51) and oversold (49) thresholds, the script projects these momentum levels directly onto the price chart as dynamic bands. This allows the trader to see where the price would be if it reached those specific RSI exhaustion points.
2. The Multi-Layered Support & Resistance Matrix
The core strength of the script lies in its 20-level calculation engine. It computes 10 distinct resistance levels (H1-H10) and 10 distinct support levels (L1-L10) using a hybrid blend of:
* Exponential Moving Averages (EMA)
* Average True Range (ATR)
* Historical Extremes (High/Low Lookbacks)
* Price Action Ratios
These levels are then averaged to create the Final Resistance and Support Averages, providing a "solid" boundary that filters out market noise more effectively than a single moving average.
3. Volatility-Adjusted Dynamic Expansion
To adapt to changing market conditions, the indicator employs an ATR-based expansion mechanism. By applying a user-defined multiplier to the current ATR, the bands expand during high-volatility periods and contract during consolidation, ensuring the "Corridors" remain relevant regardless of market speed.
4. Trend Tracking & Persistence Logic
The system features a unique Signal Persistence logic. When a trend shift is detected (via an ATR-based trailing stop mechanism):
* Buy/Sell Signals: Triggered when the price breaks through the calculated trailing limits.
* Persistence Lines: Once a signal is generated, the indicator "locks" the support or resistance level at that moment and tracks it for an extended period (up to 19,999 bars). This helps traders identify long-term historical anchor points even after the immediate trend has passed.
5. Extreme Range Analysis (HH-LL)
Finally, the script calculates Extreme Upper and Lower Bounds based on the highest and lowest points of the signal tracking lines. This creates a "Master Range" that colors the chart dynamically, signaling whether the market is in a Red (Overextended High), Green (Overextended Low), or Blue (Neutral) state.
Summary of Key Features
* Hybrid Momentum/Volatility Engine: Combines RSI and ATR logic.
* Noise Reduction: Averages 20 different data points to find "True" support and resistance.
* Long-Term Reference: Unique tracking system that remembers signal levels for thousands of bars.
* Visual Clarity: Intuitive color coding for trend direction and extreme price zones.

Capitulation Detector StrategyA multi-factor capitulation detector designed to identify exhaustion points in extended trends. It focuses on fading capitulation moves after multi-leg trends with extreme volume and price extension.
━━━━━━━━━━━━━━━━━━━━━━━━━━━━━━━━━━━━━━━━
THE CONCEPT
Capitulation occurs when the last holders give up — panic selling into lows or euphoric buying into highs. These moments create asymmetric opportunities because:
Sentiment becomes maximally skewed
Weak hands are flushed out
Price deviates far from equilibrium
The "fuel" for continuation is exhausted
━━━━━━━━━━━━━━━━━━━━━━━━━━━━━━━━━━━━━━━━
THE 6 FACTORS
Trend Persistence — Price stays on one side of 38 EMA for 12+ bars, confirming a sustained directional move
Acceleration — Price stays on one side of 5 EMA for 3+ bars, showing the move is accelerating into exhaustion
Volume Spike — Current bar volume ≥ 2x the 20-bar average
Body Expansion — Candle body ≥ 1.5x average, showing conviction/panic in the move
Extension — Price is 2+ ATR away from the 38 EMA, indicating overextension from equilibrium
Multi-Leg Structure — At least 3 consecutive lower lows (for longs) or higher highs (for shorts)
━━━━━━━━━━━━━━━━━━━━━━━━━━━━━━━━━━━━━━━━
SIGNAL LOGIC
Bullish Capitulation: 4+ factors align + price below 38 EMA + down candle + volume spike
Bearish Capitulation: 4+ factors align + price above 38 EMA + up candle + volume spike
The strategy enters counter-trend, fading the exhaustion move.
━━━━━━━━━━━━━━━━━━━━━━━━━━━━━━━━━━━━━━━━
EXIT OPTIONS
ATR-based stop loss (default: 2 ATR)
ATR-based take profit (default: 3 ATR)
Optional trailing stop
Time filter for session-specific trading
━━━━━━━━━━━━━━━━━━━━━━━━━━━━━━━━━━━━━━━━
BEST PRACTICES
Works best on liquid instruments with clean trends
More reliable after 3+ legs in the trend
Higher conviction when daily AND intraday timeframes align
"The bigger and more extended, the better"
Consider VWAP as additional confirmation (not coded here)
━━━━━━━━━━━━━━━━━━━━━━━━━━━━━━━━━━━━━━━━
SETTINGS GUIDE
Min Score: Increase for fewer, higher-quality signals
Volume Spike Multiplier: 2x; increase for stricter filter
Extension ATR: Higher values = more overextended setups only
Trend Bars Min: Higher values = longer established trends required
━━━━━━━━━━━━━━━━━━━━━━━━━━━━━━━━━━━━━━━━
ALERTS
Bullish Capitulation (potential long)
Bearish Capitulation (potential short)
━━━━━━━━━━━━━━━━━━━━━━━━━━━━━━━━━━━━━━━━
DISCLAIMER
This is a counter-trend strategy — inherently higher risk than trend-following. Always use proper position sizing and risk management. Backtest thoroughly on your specific instruments and timeframes.

ATR Stop Loss Finder (Strict Breakout Mode)Title: ATR Stop Loss Finder (Strict Breakout Mode)
Description:
Volatility-Based Risk Management: Generates dynamic trailing stop-loss lines for both Long (Lower Line) and Short (Upper Line) positions based on ATR volatility.
Strict Breakout Detection: Features a unique "Strict Breakout" logic that highlights trend acceleration. It visually marks whenever the Long SL breaks a historical high or the Short SL breaks a historical low over a user-defined lookback period (e.g., 50 bars).
Visual Signals: Automatically plots Red Circles for bullish SL breakouts (New Highs) and Blue Circles for bearish SL breakdowns (New Lows), making strong momentum shifts easy to spot.
Real-Time Dashboard: Includes an informative table displaying current ATR and SL price levels for quick reference.

Adaptive Volatility Stop by Pedro Paulo de MeloStop ATR is a clean and reliable volatility-based trailing stop system, built to adapt dynamically to market conditions using the Average True Range (ATR).
It identifies trend direction, adjusts the stop level using stair-step logic, and automatically flips the stop when price reversals occur.
How it works
Uses ATR × Multiplier to calculate an adaptive volatility buffer
Tracks trend direction internally
Recomputes and repositions the stop when a trend flip is detected
Plots separate lines for bullish and bearish stop states
Works on any market and timeframe (crypto, forex, commodities, indices, stocks)
Why it’s useful
This Stop ATR implementation is extremely stable and visually clean.
It is particularly effective for:
Trend following
Position management
Swing and position trading
Systematic stop placement
Unlike many ATR-based stop versions, this script uses a corrected flip-handling method that prevents stop misalignment and ensures consistent trend state tracking.
Inputs
Period — ATR length
Multiplier — ATR factor that defines stop distance
Author
Developed by Pedro Paulo de Melo, open-source version.

5MA+TrendMagic + Disparity Scalping (SIMPLE FILTER)5MA + Trend Filter + Disparity Scalping
This multi-purpose indicator combines a five-EMA trend structure, a volatility-based trend filter, and an ultra-fast scalping module to detect both trend continuation and sharp reversal opportunities.
It is suitable for scalping, day trading, and trend-following strategies.
🔹 Main Components
1️⃣ Five-EMA Trend Structure
Displays 9 / 20 / 50 / 100 / 200 EMA levels
Helps identify short-term and long-term market direction
Useful for support and resistance during trending markets
2️⃣ Volatility-Driven Trend Filter
Uses CCI and ATR to form a dynamic trailing line
The line switches color based on momentum direction
Can act as a trailing stop or trend confirmation filter
Helps avoid counter-trend entries
3️⃣ High-Volatility GOLD Signal
Detects sudden volatility expansions using ATR, Bollinger metrics, and volatility comparison (HV vs RV)
Marks rapid breakout situations with potential continuation setups
Available for all assets, optimized for highly volatile markets
4️⃣ Ultra-Fast Disparity Scalper
Measures price deviation from EMA5 and EMA10
Confirms exhaustion using RSI + momentum prediction from a custom RVI model
Generates early BUY/SELL reversal markers
Detects momentum shifts before price fully reacts
5️⃣ Simple Overheat Filter
Prevents trades in extremely overbought/oversold zones
Gray-colored signals indicate unsafe trades to avoid
🎯 Best Use Cases
Catching early reversals during fast movement
Identifying strong trend continuation after volatility expansion
Avoiding low-probability scalps in overheated conditions
Applying EMA structure for confluence with price action
⚠️ Note
This indicator is a decision-support tool, not a standalone signal generator.
For best precision, combine with:
Market structure
Volume analysis
Support / resistance levels
🏷️ Short Description (for compact field)
Multi-function tool combining 5EMA structure, volatility-based trend filtering, and ultra-fast reversal scalping using RSI + custom RVI momentum. Ideal for both trend continuation and rapid reversals.

DarkPool FlowDarkPool Flow is a professional-grade technical analysis tool designed to align retail traders with the dominant "smart money" flow. Unlike standard moving average crossovers that often generate false signals during consolidation, this script employs a multi-layered filtering engine to isolate high-probability trends.
The core philosophy of this indicator is that Trends are fractal. A sustainable move on a lower timeframe must be supported by momentum on a higher timeframe. By comparing a "Fast Signal Trend" against a "Slow Anchor Trend" (e.g., Daily vs. Weekly), the script identifies the market bias used by institutional algorithms.
This edition features a Smart Recovery Engine, ensuring that valid trends are not missed simply because momentum started slowly, and a Dynamic Cloud that visually represents the strength of the trend spread.
Key Features
1. Auto-Adaptive Timeframe Logic
The script eliminates the guesswork of Multi-Timeframe (MTF) selection. By enabling "Auto-Adapt," the indicator detects your current chart timeframe and automatically maps it to the mathematically correct institutional pairings:
Scalping (<15m): Uses 15-Minute Trend vs. 1-Hour Anchor.
Day Trading (15m - 1H): Uses 4-Hour Trend vs. Daily Anchor.
Swing Trading (4H - Daily): Uses Daily Trend vs. Weekly Anchor (The classic "Golden" setup).
Investing (Weekly): Uses 21-Week EMA vs. 50-Week SMA (Bull Market Support Band logic).
2. Smart Recovery Signal Engine
Standard crossover scripts often miss major moves if the specific breakout candle has low volume or weak ADX. This script utilizes a state-machine logic that "remembers" the trend direction. If a trend begins during low volatility (gray candles), the script waits. The moment volatility and momentum confirm the move, a Smart Recovery Signal is triggered, allowing you to enter an existing trend safely.
3. Chop Protection (Gray Candles)
Preservation of capital is the priority. The script analyzes the Average Directional Index (ADX) and Volatility (ATR).
Colored Candles (Green/Red): The market is trending with sufficient strength. Trading is permitted.
Gray Candles: The market is in a low-energy chop or consolidation (ADX < 20). Trading is discouraged.
4. Dynamic Trend Cloud
The space between the Fast and Slow trends is filled with a dynamic cloud.
Darker/Opaque Cloud: Indicates a widening spread, suggesting accelerating momentum.
Lighter/Transparent Cloud: Indicates a narrowing spread, suggesting the trend may be weakening or consolidating.
5. Pullback & Retest Signals (+)
While triangles mark the start of a trend, the Plus (+) signs mark low-risk opportunities to add to a position. These appear when price dips into the cloud, finds support at the "Fair Value" zone, and closes back in the direction of the trend with confirmed momentum.
User Guide & Strategy
Setup
Add the indicator to your chart.
For Beginners: Enable "Auto-Adaptive Timeframes" in the settings.
For Advanced Users: Disable Auto-Adapt and manually configure your Fast/Slow pairings (Default is Daily 50 EMA / Weekly 50 EMA).
Signal Mode: Choose "First Breakout Only" for a cleaner chart, or "All Signals" if you wish to see re-entry points during choppy starts.
Long Entry Criteria (Buy)
Trend: The Cloud must be Green (Fast Trend > Slow Trend).
Signal: A Green Triangle appears below the bar.
Confirmation: The signal candle must not be Gray.
Re-Entry: A small Green (+) sign appears, indicating a successful test of the cloud support.
Short Entry Criteria (Sell)
Trend: The Cloud must be Red (Fast Trend < Slow Trend).
Signal: A Red Triangle appears above the bar.
Confirmation: The signal candle must not be Gray.
Re-Entry: A small Red (+) sign appears, indicating a successful test of the cloud resistance.
Stop Loss & Risk Management
Stop Loss: A standard institutional stop loss is placed just beyond the Slow Trend Line (the outer edge of the cloud). If price closes beyond the Slow Trend, the macro thesis is invalid.
Take Profit: Target liquidity pools or use a trailing stop based on the Fast Trend line.
Settings Overview
Mode Selection: Toggle between Auto-Adaptive logic or Manual control.
Manual Configuration: Define the specific Timeframe, Length, and Type (EMA, SMA, WMA) for both Fast and Slow trends.
Signal Logic: Toggle "Show Pullback Signals" on/off. Switch between "First Breakout" or "All Signals."
Quality Filters: Toggle individual filters (ATR, RSI, ADX) to adjust sensitivity. Turning these off makes the script more responsive but increases false signals.
Visual Style: Customize colors for Bullish, Bearish, and Neutral (Gray) states. Adjust cloud transparency.
Disclaimer
Risk Warning: Trading financial markets involves a high degree of risk and is not suitable for all investors. You could lose some or all of your initial investment.
Educational Use Only: This script and the information provided herein are for educational and informational purposes only. They do not constitute financial advice, investment advice, trading advice, or any other recommendation.
No Guarantee: Past performance of any trading system or methodology is not necessarily indicative of future results. The "Institutional Trend" indicator is a tool to assist in technical analysis, not a crystal ball. The creators of this script assume no responsibility or liability for any trading losses or damages incurred as a result of using this tool. Always perform your own due diligence and consult with a qualified financial advisor before making investment decisions.

Estrategia Trend Following: 52w/26w BreakoutThis is a classic long-term Trend Following strategy, heavily inspired by the Donchian Channel system and the legendary "Turtle Trading" rules. It is designed to capture major market moves (bull runs) while filtering out short-term market noise and volatility.
This script is ideal for investors and swing traders who prefer a "hands-off" approach, looking to catch large trends rather than day-trading small fluctuations.
How it Works:
1. Entry Condition (The Breakout):
52-Week High: The strategy enters a Long position when the price breaks above the highest high of the last 252 trading days (approx. 1 year).
SuperTrend Filter: An additional filter using the SuperTrend indicator ensures that the breakout is supported by positive momentum, helping to reduce false signals during choppy lateral markets.
2. Exit Condition (The Trailing Stop):
26-Week Low: The strategy ignores short-term corrections. It only closes the position if the price closes below the lowest low of the last 126 trading days (approx. 6 months).
This wide stop allows the trade to "breathe" and stay open during significant pullbacks, ensuring you stay in the trend for as long as possible.
Features & Settings:
Customizable Lookback Periods: You can adjust the Entry (default 252 days) and Exit (default 126 days) periods in the settings menu.
Visual Aids:
Blue Line: Represents the 1-Year High (Entry Threshold).
Red Line: Represents the 6-Month Low (Dynamic Stop Loss).
Channel Shading: Visualizes the trading range between the high and low.
Labels: Clearly marks "BUY" and "EXIT" points on the chart.
Recommended Usage:
Timeframe: Daily (1D). This logic is designed for daily candles.
Assets: Works best on assets with strong trending characteristics (e.g., Bitcoin/Crypto, Tech Stocks, Indices like SPX/NDX, and Commodities).
Patience Required: This strategy generates very few signals. It may stay quiet for months and then hold a position for over a year.

Triple EMA + RSI + ATRThis comprehensive trading system combines triple EMA alignment, RSI momentum filtering, and dynamic ATR-based risk management. The strategy enters positions only when fast, medium, and slow EMAs align in proper order (bullish or bearish), confirmed by RSI remaining within defined thresholds (not overbought/oversold) and a volume spike above its moving average. Exits are managed intelligently using a multi-tier approach: a fixed stop-loss based on ATR, a first profit target at a predefined risk-reward ratio, and a trailing stop that activates after reaching a second, higher profit tier. Designed for trend-following with built-in momentum and volume confirmation, it features professional order execution with configurable commission and slippage for realistic backtesting. Visual cues including colored backgrounds and signal shapes enhance chart clarity.

EMA + Sessions + RSI Strategy v1.0A professional trading strategy that combines multiple technical indicators for high-probability entries. This system uses EMA crossovers, RSI zone filtering, and trend confirmation to identify optimal trading opportunities while managing risk with advanced position management tools.
Key Features:
✅ Dual Entry Signals (EMA21 + EMA100 crossover conditions)
✅ Trend Filter EMA750 (trade only with the major trend)
✅ Complete Risk Management (SL 1%, TP 3% default)
✅ Trailing Stop & Breakeven (maximize profits, protect capital)
✅ Compact Statistics Table (real-time performance metrics)
✅ RSI & Session Filters (avoid low-probability setups)
✅ Optional Pyramiding (scale into winning positions)
Perfect for swing trading and trend-following on any timeframe. Fully customizable to match your trading style.

Strategy: HMA 50 + Supertrend SniperHMA 50 + Supertrend Confluence Strategy (Trend Following with Noise Filtering)
Description:
Introduction and Concept This strategy is designed to solve a common problem in trend-following trading: Lag vs. False Signals. Standard Moving Averages often lag too much, while price action indicators can generate false signals during choppy markets. This script combines the speed of the Hull Moving Average (HMA) with the volatility-based filtering of the Supertrend indicator to create a robust "Confluence System."
The primary goal of this script is not just to overlay two indicators, but to enforce a strict rule where a trade is only taken when Momentum (HMA) and Volatility Direction (Supertrend) are in perfect agreement.
Why this combination? (The Logic Behind the Mashup)
Hull Moving Average (HMA 50): We use the HMA because it significantly reduces lag compared to SMA or EMA by using weighted calculations. It acts as our primary Trend Direction detector. However, HMA can be too sensitive and "whipsaw" during sideways markets.
Supertrend (ATR-based): We use the Supertrend (Factor 3.0, Period 10) as our Volatility Filter. It uses Average True Range (ATR) to determine the significant trend boundary.
How it Works (Methodology) The strategy uses a boolean logic system to filter out low-quality trades:
Bullish Confluence: The HMA must be rising (Slope > 0) AND the Close Price must be above the Supertrend line (Uptrend).
Bearish Confluence: The HMA must be falling (Slope < 0) AND the Close Price must be below the Supertrend line (Downtrend).
The "Choppy Zone" (Noise Filter): This is a unique feature of this script. If the HMA indicates one direction (e.g., Rising) but the Supertrend indicates the opposite (e.g., Downtrend), the market is considered "Choppy" or indecisive. In this state, the script paints the candles or HMA line Gray and exits all positions (optional setting) to preserve capital.
Visual Guide & Signals To make the script easy to interpret for traders who do not read Pine Script, I have implemented specific visual cues:
Green Cross (+): Indicates a LONG entry signal. Both HMA and Supertrend align bullishly.
Red Cross (X): Indicates a SHORT entry signal. Both HMA and Supertrend align bearishly.
Thick Line (HMA): The main line changes color based on the trend.
Green: Bullish Confluence.
Red: Bearish Confluence.
Gray: Divergence/Choppy (No Trade Zone).
Thin Step Line: This is the Supertrend line, serving as your dynamic Trailing Stop Loss.
Strategy Settings
HMA Length: Default is 50 (Mid-term trend).
ATR Factor/Period: Default is 3.0/10 (Standard for trend catching).
Exit on Choppy: A toggle switch allowing users to decide whether to hold through noise or exit immediately when indicators disagree.
Risk Warning This strategy performs best in trending markets (Forex, Crypto, Indices). Like all trend-following systems, it may experience drawdown during prolonged accumulation/distribution phases. Please backtest with your specific asset before using it with real capital.

Superior-Range Bound Renko - Alerts - 11-29-25 - Signal LynxSuperior-Range Bound Renko – Alerts Edition with Advanced Risk Management Template
Signal Lynx | Free Scripts supporting Automation for the Night-Shift Nation 🌙
1. Overview
This is the Alerts & Indicator Edition of Superior-Range Bound Renko (RBR).
The Strategy version is built for backtesting inside TradingView.
This Alerts version is built for automation: it emits clean, discrete alert events that you can route into webhooks, bots, or relay engines (including your own Signal Lynx-style infrastructure).
Under the hood, this script contains the same core engine as the strategy:
Adaptive Range Bounding based on volatility
Renko Brick Emulation on standard candles
A stack of Laguerre Filters for impulse detection
K-Means-style Adaptive SuperTrend for trend confirmation
The full Signal Lynx Risk Management Engine (state machine, layered exits, AATS, RSIS, etc.)
The difference is in what we output:
Instead of placing historical trades, this version:
Plots the entry and RM signals in a separate pane (overlay = false)
Exposes alertconditions for:
Long Entry
Short Entry
Close Long
Close Short
TP1, TP2, TP3 hits (Staged Take Profit)
This makes it ideal as the signal source for automated execution via TradingView Alerts + Webhooks.
2. Quick Action Guide (TL;DR)
Best Timeframe:
4H and above. This is a swing-trading / position-trading style engine, not a micro-scalper.
Best Assets:
Volatile but structured markets, e.g.:
BTC, ETH, XAUUSD (Gold), GBPJPY, and similar high-volatility majors or indices.
Script Type:
indicator() – Alerts & Visualization Only
No built-in order placement
All “orders” are emitted as alerts for your external bot or manual handling
Strategy Type:
Volatility-Adaptive Trend Following + Impulse Detection
using Renko-like structure and multi-layer Laguerre filters.
Repainting:
Designed to be non-repainting on closed candles.
The underlying Risk Management engine is built around previous-bar data (close , high , low ) for execution-critical logic.
Intrabar values can move while the bar is forming (normal for any advanced signal), but once a bar closes, the alert logic is stable.
Recommended Alert Settings:
Condition: one of the built-in signals (see section 3.B)
Options: “Once Per Bar Close” is strongly recommended for automation
Message: JSON, CSV, or simple tokens – whatever your webhook / relay expects
3. Detailed Report: How the Alerts Edition Works
A. Relationship to the Strategy Version
The Alerts Edition shares the same internal logic as the strategy version:
Same Adaptive Lookback and volatility normalization
Same Range and Close Range construction
Same Renko Brick Emulator and directional memory (renkoDir)
Same Fib structures, Laguerre stack, K-Means SuperTrend, and Baseline signals (B1, B2)
Same Risk Management Engine and layered exits
In the strategy script, these signals are wired into strategy.entry, strategy.exit, and strategy.close.
In the alerts script:
We still compute the final entry/exit signals (Fin, CloseEmAll, TakeProfit1Plot, etc.)
Instead of placing trades, we:
Plot them for visual inspection
Expose them via alertcondition(...) so that TradingView can fire alerts.
This ensures that:
If you use the same settings on the same symbol/timeframe, the Alerts Edition and Strategy Edition agree on where entries and exits occur.
(Subject only to normal intrabar vs. bar-close differences.)
B. Signals & Alert Conditions
The alerts script focuses on discrete, automation-friendly events.
Internally, the main signals are:
Fin – Final entry decision from the RM engine
CloseEmAll – RM-driven “hard close” signal (for full-position exits)
TakeProfit1Plot / 2Plot / 3Plot – One-time event markers when each TP stage is hit
On the chart (in the separate indicator pane), you get:
plot(Fin) – where:
+2 = Long Entry event
-2 = Short Entry event
plot(CloseEmAll) – where:
+1 = “Close Long” event
-1 = “Close Short” event
plot(TP1/TP2/TP3) (if Staged TP is enabled) – integer tags for TP hits:
+1 / +2 / +3 = TP1 / TP2 / TP3 for Longs
-1 / -2 / -3 = TP1 / TP2 / TP3 for Shorts
The corresponding alertconditions are:
Long Entry
alertcondition(Fin == 2, title="Long Entry", message="Long Entry Triggered")
Fire this to open/scale a long position in your bot.
Short Entry
alertcondition(Fin == -2, title="Short Entry", message="Short Entry Triggered")
Fire this to open/scale a short position.
Close Long
alertcondition(CloseEmAll == 1, title="Close Long", message="Close Long Triggered")
Fire this to fully exit a long position.
Close Short
alertcondition(CloseEmAll == -1, title="Close Short", message="Close Short Triggered")
Fire this to fully exit a short position.
TP 1 Hit
alertcondition(TakeProfit1Plot != 0, title="TP 1 Hit", message="TP 1 Level Reached")
First staged take profit hit (either long or short). Your bot can interpret the direction based on position state or message tags.
TP 2 Hit
alertcondition(TakeProfit2Plot != 0, title="TP 2 Hit", message="TP 2 Level Reached")
TP 3 Hit
alertcondition(TakeProfit3Plot != 0, title="TP 3 Hit", message="TP 3 Level Reached")
Together, these give you a complete trade lifecycle:
Open Long / Short
Optionally scale out via TP1/TP2/TP3
Close remaining via Close Long / Close Short
All while the Risk Management Engine enforces the same logic as the strategy version.
C. Using This Script for Automation
This Alerts Edition is designed for:
Webhook-based bots
Execution relays (e.g., your own Lynx-Relay-style engine)
Dedicated external trade managers
Typical setup flow:
Add the script to your chart
Same symbol, timeframe, and settings you use in the Strategy Edition backtests.
Configure Inputs:
Longs / Shorts enabled
Risk Management toggles (SL, TS, Staged TP, AATS, RSIS)
Weekend filter (if you do not want weekend trades)
RBR-specific knobs (Adaptive Lookback, Brick type, ATR vs Standard Brick, etc.)
Create Alerts for Each Event Type You Need:
Long Entry
Short Entry
Close Long
Close Short
TP1 / TP2 / TP3 (optional, if your bot handles partial closes)
For each:
Condition: the corresponding alertcondition
Option: “Once Per Bar Close” is strongly recommended
Message:
You can use structured JSON or a simple token set like:
{"side":"long","event":"entry","symbol":"{{ticker}}","time":"{{timenow}}"}
or a simpler text for manual trading like:
LONG ENTRY | {{ticker}} | {{interval}}
Wire Up Your Bot / Relay:
Point TradingView’s webhook URL to your execution engine
Parse the messages and map them into:
Exchange
Symbol
Side (long/short)
Action (open/close/partial)
Size and risk model (this script does not position-size for you; it only signals when, not how much.)
Because the alerts come from a non-repainting, RM-backed engine that you’ve already validated via the Strategy Edition, you get a much cleaner automation pipeline.
D. Repainting Protection (Alerts Edition)
The same protections as the Strategy Edition apply here:
Execution-critical logic (trailing stop, TP triggers, SL, RM state changes) uses previous bar OHLC:
open , high , low , close
No security() with lookahead or future-bar dependencies.
This means:
Alerts are designed to fire on states that would have been visible at bar close, not on hypothetical “future history.”
Important practical note:
Intrabar: While a bar is forming, internal conditions can oscillate.
Bar Close: With “Once Per Bar Close” alerts, the fired signal corresponds to the final state of the engine for that candle, matching your Strategy Edition expectations.
4. For Developers & Modders
You can treat this Alerts script as an ”RM + Alert Framework” and inject any signal logic you want.
Where to plug in:
Find the section:
// BASELINE & SIGNAL GENERATION
You’ll see how B1 and B2 are built from the RBR stack and then combined:
baseSig = B2
altSig = B1
finalSig = sigSwap ? baseSig : altSig
To use your own logic:
Replace or wrap the code that sets baseSig / altSig with your own conditions:
e.g., RSI, MACD, Heikin Ashi filters, candle patterns, volume filters, etc.
Make sure your final decision is still:
2 → Long / Buy signal
-2 → Short / Sell signal
0 → No trade
finalSig is then passed into the RM engine and eventually becomes Fin, which:
Drives the Long/Short Entry alerts
Interacts with the RM state machine to integrate properly with AATS, SL, TS, TP, etc.
Because this script already exposes alertconditions for key lifecycle events, you don’t need to re-wire alerts each time — just ensure your logic feeds into finalSig correctly.
This lets you use the Signal Lynx Risk Management Engine + Alerts wrapper as a drop-in chassis for your own strategies.
5. About Signal Lynx
Automation for the Night-Shift Nation 🌙
Signal Lynx builds tools and templates that help traders move from:
“I have an indicator” → “I have a structured, automatable strategy with real risk management.”
This Superior-Range Bound Renko – Alerts Edition is the automation-focused companion to the Strategy Edition. It’s designed for:
Traders who backtest with the Strategy version
Then deploy live signals with this Alerts version via webhooks or bots
While relying on the same non-repainting, RM-driven logic
We release this code under the Mozilla Public License 2.0 (MPL-2.0) to support the Pine community with:
Transparent, inspectable logic
A reusable Risk Management template
A reference implementation of advanced adaptive logic + alerts
If you are exploring full-stack automation (TradingView → Webhooks → Exchange / VPS), keep Signal Lynx in your search.
License: Mozilla Public License 2.0 (Open Source).
If you build improvements or helpful variants, please consider sharing them back with the community.

Super-AO with Risk Management Alerts Template - 11-29-25Super-AO with Risk Management: ALERTS & AUTOMATION Edition
Signal Lynx | Free Scripts supporting Automation for the Night-Shift Nation 🌙
1. Overview
This is the Indicator / Alerts companion to the Super-AO Strategy.
While the Strategy version is built for backtesting (verifying profitability and checking historical performance), this Indicator version is built for Live Execution.
We understand the frustration of finding a great strategy, only to realize you can't easily hook it up to your trading bot. This script solves that. It contains the exact same "Super-AO" logic and "Risk Management Engine" as the strategy version, but it is optimized to send signals to automation platforms like Signal Lynx, 3Commas, or any Webhook listener.
2. Quick Action Guide (TL;DR)
Purpose: Live Signal Generation & Automation.
Workflow:
Use the Strategy Version to find profitable settings.
Copy those settings into this Indicator Version.
Set a TradingView Alert using the "Any Alert() function call" condition.
Best Timeframe: 4 Hours (H4) and above.
Compatibility: Works with any webhook-based automation service.
3. Why Two Scripts?
Pine Script operates in two distinct modes:
Strategy Mode: Calculates equity, drawdowns, and simulates orders. Great for research, but sometimes complex to automate.
Indicator Mode: Plots visual data on the chart. This is the preferred method for setting up robust alerts because it is lighter weight and plots specific values that automation services can read easily.
The Golden Rule: Always backtest on the Strategy, but trade on the Indicator. This ensures that what you see in your history matches what you execute in real-time.
4. How to Automate This Script
This script uses a "Visual Spike" method to trigger alerts. Instead of drawing equity curves, it plots numerical values at the bottom of your chart when a trade event occurs.
The Signal Map:
Blue Spike (2 / -2): Entry Signal (Long / Short).
Yellow Spike (1 / -1): Risk Management Close (Stop Loss / Trend Reversal).
Green Spikes (1, 2, 3): Take Profit Levels 1, 2, and 3.
Setup Instructions:
Add this indicator to your chart.
Open your TradingView "Alerts" tab.
Create a new Alert.
Condition: Select SAO - RM Alerts Template.
Trigger: Select Any Alert() function call.
Message: Paste your JSON webhook message (provided by your bot service).
5. The Logic Under the Hood
Just like the Strategy version, this indicator utilizes:
SuperTrend + Awesome Oscillator: High-probability swing trading logic.
Non-Repainting Engine: Calculates signals based on confirmed candle closes to ensure the alert you get matches the chart reality.
Advanced Adaptive Trailing Stop (AATS): Internally calculates volatility to determine when to send a "Close" signal.
6. About Signal Lynx
Automation for the Night-Shift Nation 🌙
We are providing this code open source to help traders bridge the gap between manual backtesting and live automation. This code has been in action since 2022.
If you are looking to automate your strategies, please take a look at Signal Lynx in your search.
License: Mozilla Public License 2.0 (Open Source). If you make beneficial modifications, please release them back to the community!

The Trade Plan 9 & 15 EMA⭐ What Are EMAs?
An Exponential Moving Average (EMA) gives more weight to recent prices, making it more responsive than a simple moving average.
9-EMA = very fast, reacts quickly to price changes
15-EMA = slightly slower, smooths short-term noise
Together they help identify momentum shifts.
📈 How the 9/15 EMA Strategy Works
1. Buy Signal (Bullish Crossover)
You enter a long (buy) trade when:
➡ 9 EMA crosses above the 15 EMA
This suggests momentum is shifting upward and a new uptrend may be forming.
2. Sell Signal (Bearish Crossover)
You enter a short (sell) trade or exit long positions when:
➡ 9 EMA crosses below the 15 EMA
This suggests momentum is turning downward.
🔧 How Traders Typically Use It
Entry
Wait for a clear crossover.
Confirm with price closing on the same side of EMAs.
Some traders add confirmation using RSI, MACD, or support/resistance.
Exit
Several options:
Exit when the opposite crossover occurs.
Exit at predetermined risk-reward levels (e.g., 1:2).
Use trailing stop below/above EMAs.
👍 Strengths
Easy to follow
Good for fast-moving markets
Works well on trending markets
Minimal indicators needed
👎 Weaknesses
Whipsaws in sideways markets
Many false signals on very low timeframes
Works best with additional filters
🕒 Common Timeframes
Scalping: 1m, 5m
Day trading: 5m, 15m
Swing trading: 1H, 4H

Long-Term Strategy: 1-Year Breakout + 6-Month ExitDescripción (Description): (Copia y pega todo lo que está dentro del recuadro de abajo)
Description
This is a long-term trend-following strategy designed to capture major market moves while filtering out short-term noise. It is based on the classic principle of "buying strength" (Breakouts) and allowing profits to run, while cutting losses when the medium-term trend reverses.
How it Works (Logic)
1. Entry Condition (Long Only): The strategy looks for a significant display of strength. It enters a Long position only when two conditions are met simultaneously:
Price Breakout: The closing price exceeds the highest high of the last 252 trading days (approximately 1 year). This ensures we are entering during a strong momentum phase.
Trend Filter: The SuperTrend indicator (Settings: ATR 10, Factor 3.0) must be bullish. This acts as a confirmation filter to avoid false breakouts in choppy markets.
2. Exit Condition: The strategy uses a trailing stop based on price action, not a fixed percentage.
It closes the position when the price closes below the lowest low of the last 126 trading days (approximately 6 months).
This wide exit allows the trade to "breathe" during normal market corrections without exiting the position prematurely.
Settings & Risk Management
Capital Usage: The script is configured to use 10% of equity per trade to reflect realistic risk management (compounding).
Commissions: Included at 0.1% to simulate real trading costs.
Slippage: Included (3 ticks) to account for market execution variability.
Best Use: This strategy is intended for higher timeframes (Daily or Weekly) on trending assets like Indices, Crypto, or Commodities.

Fibonacci Retrace + 50 EMA Hariss 369This indicator combines 3 concepts:
Fibonacci retracement zones
50 EMA trend filter
Price interaction with specific Fib zones to generate Buy/Sell signals
Let’s break everything down in simple language.
1. Fibonacci Retracement Logic
The script finds:
Most recent swing high
Most recent swing low
Using these two points, it draws Fibonacci levels:
Fibonacci Levels Used
Level Meaning Calculation
0% Swing Low recentLow
38.2% Light retracement high - (range × 0.382)
50% Mid retracement high - (range × 0.50)
61.8% Deep retracement high - (range × 0.618)
100% Swing High recentHigh
🔍 Why only these levels?
Because trading signals are generated based ONLY on:38.2%, 50%,61.8%
These 3 levels define the golden retracement zones.
2. Trend Filter — 50 EMA
A powerful rule:
Trend Up (bullish)
➡️ Price > 50 EMA
Trend Down (bearish)
➡️ Price < 50 EMA
This prevents signals against the main trend.
3. BUY Conditions (Retracement + EMA)
A BUY signal appears when:
Price is above the 50 EMA (trend is up)
Price retraces into the BUY ZONE:
🔵 BUY ZONE = between 50% and 38.2% Fibonacci i.e.,close >= Fib50 AND close <= Fib38.2
This means:
Market is trending up
Price corrected to a healthy retracement level
Buyers are stepping back in
📘 Why this zone?
This is a moderate retracement (not too shallow, not too deep).
Smart money often enters at 38.2%–50% in a strong trend.
📘 BUY Signal Appears With:
Green “BUY” label
Green arrow below the candle
4. SELL Conditions (Retracement + EMA)
A SELL signal appears when:
Price is below the 50 EMA (trend is down)
Price retraces upward into the SELL ZONE:
🔴 SELL ZONE = between 50% and 61.8% Fibonacci i.e.,close <= Fib50 AND close >= Fib61.8
This means:
Market is trending down
Price made a pullback
Sellers regain control in the golden zone
📘 Why this zone?
50–61.8 retracement is the ideal bearish pullback level.
📘 SELL Signal Appears With:
Red “SELL” label
Red arrow above the candle
5. STOP-LOSS (SL) RULES
For BUY trades,
Place SL below 61.8% level.SL = Fib 61.8%
OR
more safe:SL = swing low (Fib 0%)
For SELL trades
Place SL above 38.2% level.SL = Fib 38.2%
OR conservative:
SL = swing high (Fib 100%)
6. TAKE-PROFIT (TP) RULES
Based on common Fibonacci extensions.
BUY Trade TP Options
TP Level Meaning
TP1 Return to 38.2% Quick scalping target
TP2 Return to swing high Full trend target
TP3 Breakout above swing high Trend continuation
Practical suggestion:
TP1 = 1× risk
TP2 = 2× risk
TP3 = trailing stop
SELL Trade TP Options
TP Level Meaning
TP1 Return to 61.8% Moderate bounce
TP2 Return to swing low Trend target
TP3 Break below swing low Trend continuation
7. Recommended Trading Plan (Simple)
BUY PLAN
Price > 50 EMA (uptrend)
Enter at BUY signal in 38.2–50% zone
SL at 61.8%
TP at swing high or structure break
SELL PLAN
Price < 50 EMA (downtrend)
Enter at SELL signal in 50–61.8% zone
SL above 38.2%
TP at swing low
🟩 Summary (Very Easy to Remember)
🔵 BUY
Trend: above 50 EMA
Zone: between 50% and 38.2%
SL: below 61.8%
TP: swing high
🔴 SELL
Trend: below 50 EMA
Zone: between 50% and 61.8%
SL: above 38.2%
TP: swing low

AJFFRSI+QQEROC Uses Jurik RSI for smooth, responsive momentum measurement
Incorporates QQE features for trend strength and dynamic trailing stop signals
Designed for clearer, more reliable overbought/oversold and reversal signals on TradingView
Suitable for intraday, swing, and longer-term analysis
Not a financial advice. DYOR

ATR Trailing Stop + HL2 VWAP + EMAsmain atr/ema script
use this to guage immediate trend on the 2m
use this to guage long term trend on thr 6h and one day charts.
Typicallly most accurate with futures.
